Explain implementation of Geocoding in Tableau in your experience. ? How to implement Custom Geocoding in Tableau. ? When to use Custom Geocoding in Tableau. ?
Geocoding :
Tableau FILLED and SYMBOL MAPS require Geocoding information to create a geographical map in the background. Longitude and Latitude information provides the ability to locate specific geographical locations. Tableau GENERATES latitude and longitude details in FILLED and SYMBOL MAPS. When Tableau is not able to get latitude and longitude information by default (or) If there is a need to use EXTERNAL GEOCODING file, Tableau provides the ability to IMPORT geocoding file with .CSV extension.
Creating Geocoding .csv File
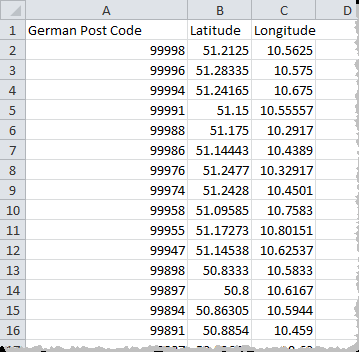
Create a geocoding file with .csv extension in a folder by using the following format.
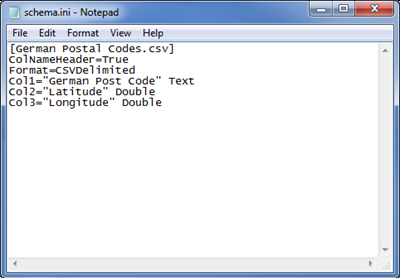
Create a schema.ini file in the same folder by using the following format.
Import Custom Geocoding
Once you have created a .csv file with custom geocoding you can import that file into Tableau. Follow the steps below to import a new geographic role. 1. Click Map > Geocoding > Import Custom Geocoding. 2. In the Import Custom Geocoding dialog box, click the button to the right of the text field to browse to the folder your import file is saved in. All files in the folder will be imported into Tableau.
The following are some more details related to Geocoding.
Build a Map View
When creating a map view, Tableau automatically adds the generated Latitude and Longitude fields to the Rows and Columns shelves and places a selected geographic field on Detail on the Marks card. The marks in the view correspond to the field on Detail. For example, if the State field is used in the view, there is a single mark for each state in your data. As you add more geographic fields to Detail on the Marks card, the marks in the view will be broken down by the members of those fields.
Geocoding - Geographic roles with description
Below is a table describing some of the types of information Tableau can geocode.
| Geographic Role | Description |
| Area Code | U.S. Area Codes; numbers only. Examples: 206, 650, 415 |
| CBSA/MSA | U.S. Core Based Statistical Area or Metropolitan Statistical Area. Examples: Dallas-Fort Worth-Arlington, TX |
| City | Worldwide city names. Examples: Seattle, Bordeaux, Stuttgart |
| Congressional District | U.S. Congressional District names. Boundaries are determined by data provided by each state's redistricting commission. Examples: 1st District, 2, District 3, 4th |
| Country/Region | Worldwide countries and regions. Includes names, FIPS 10, 2 Character (ISO 3166-1), or 3 Character(ISO 3166-1). Examples: AF, CD, Japan, Australia, BH, AFG, UKR |
| County | Second-level administrative divisions for select countries. For example, U.S. counties, French départements, German kriese, etc. |
| Latitude | Latitude in decimal degrees. Only available for numeric fields. |
| Longitude | Longitude in decimal degrees. Only available for numeric fields. |
| State/Province | Worldwide state, province, and other first-level administrative divisions. Names are in English, French, German, Spanish, Brazilian-Portuguese, Japanese, Korean, and Simplified Chinese. |
| ZIP Code/Postcode | ZIP Codes and Postcodes for the United States, France, Germany, Japan, the United Kingdom, Canada, Australia, and New Zealand. |